Medications · Jan 12, 2026
Medication list not supplied. Unknown does not mean no medication use.

Personal Surveillance System
Bring your lab reports together, compare results over time, and review the evidence behind your next conversation with your clinician.
Free: three documents to start, then one per calendar month.

01 / Your record, connected
Keep results, dates, and sources together. Add context, then return to the questions that matter.

Upload supported lab reports. Review recognized markers, units, dates, and source records.
Compare available results with your medication, supplement, and health history. Keep uncertainty visible.
Follow changes and revisit earlier observations as more information arrives.
For information and review with your clinician. Longview does not diagnose, provide emergency monitoring, or replace medical care.
02 / Begin with what you have
Start with three documents, then add one per calendar month. Basic dashboard and JSON/CSV export included.
Or $200/year. 7-day trial included.
Unlimited document uploads, advanced analysis, source-linked research, selective interaction review, and model estimates.
Lab testing and clinician care are not included. Research coverage varies; source status is shown in your workspace.
03 / Explore a comparison
One record, several ways to read it. Select a context and a date.
Illustrative data · Not a patient record, diagnosis, or app screenshot.
A whole-record view spans cardiovascular and metabolic markers, kidney and liver measures, hormones, blood counts and nutrients, medications, health history, and research. What can be reviewed depends on the information available.
Each measure uses its own vertical scale. Lines connect observations; no values are inferred between dates. Gold marks the selected date, not a risk level.
Each measure uses its own vertical scale. Lines connect observations, not inferred measurements. Gold marks the selected date, not a risk level.
Medications · Jan 12, 2026
Medication list not supplied. Unknown does not mean no medication use.
Health history · Jan 12, 2026
Health history and recent illness are not supplied. Missing context stays explicit.
Research · Jan 12, 2026
The Diabetes Prevention Program studied prevention in a population at high risk of type 2 diabetes. Population findings are not measurements or treatment advice for this illustrative record.
NIDDK · Diabetes Prevention Program ↗Reading the record
One set of results establishes a reference point. It cannot explain a trend on its own.
Weight is a separate measurement. Fasting status, measurement conditions, and medication context are not supplied.
Illustrative lab report and weight entry · Jan 12, 2026
| Source date | Weight kg |
Triglycerides mg/dL |
HbA1c % |
|---|---|---|---|
| Jan 12, 2026 | 78 | 110 | 5.3 |
| Apr 13, 2026 | 81 | 168 | 5.4 |
| Jul 13, 2026 | 80 | 132 | 5.4 |
| Source date | Creatinine mg/dL |
Cystatin C mg/L |
CK U/L |
|---|---|---|---|
| Jan 12, 2026 | 0.98 | 0.88 | 120 |
| Apr 13, 2026 | 1.16 | 0.89 | 248 |
| Jul 13, 2026 | 1.03 | 0.9 | 154 |
Jan 12, 2026: Medication list, health history, and recent illness are not supplied.
Apr 13, 2026: A medication change and recent illness are noted. Drug name, dose, timing, illness onset, and severity are not supplied. No causal relationship is established.
Jul 13, 2026: Updated medication and illness histories are not supplied. The later results do not prove a treatment effect or recovery.
At all three illustrative dates, research is a separate source: NIDDK · Diabetes Prevention Program. Population evidence is not a personal measurement, diagnosis, or treatment recommendation.
04 / The whole body
Explore nine system views. Seven contribute to a supporting marker index; Cognitive and Structural remain advisory.
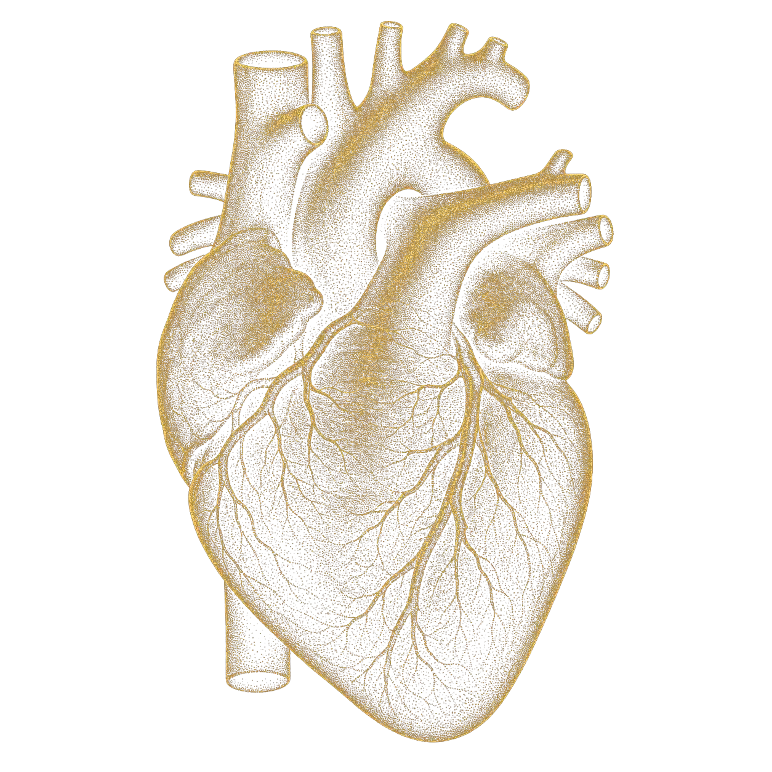
Lipids and vascular context, including ApoB, LDL-C, and hs-CRP.
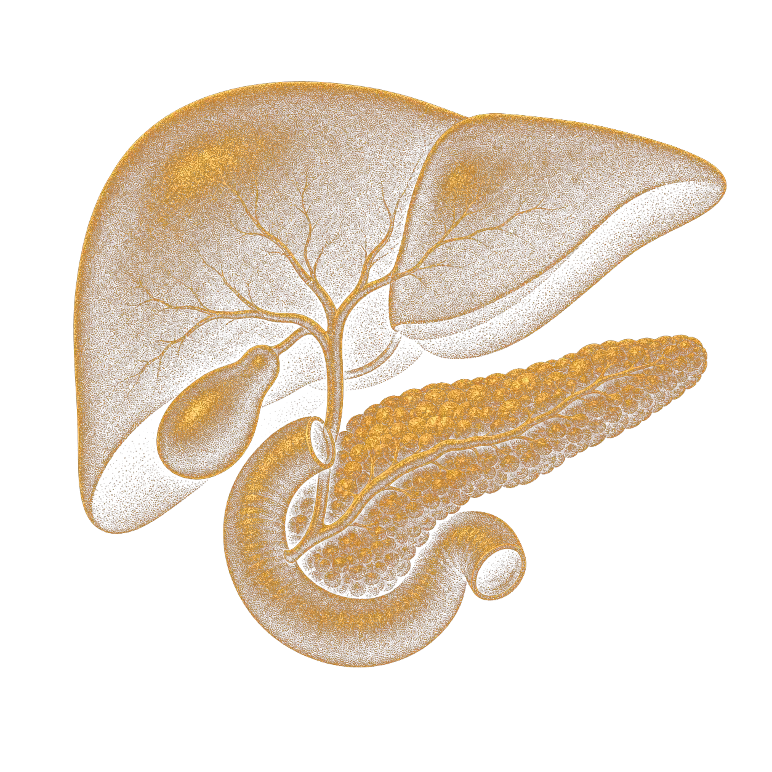
Glucose regulation and metabolic markers, including HbA1c and insulin.
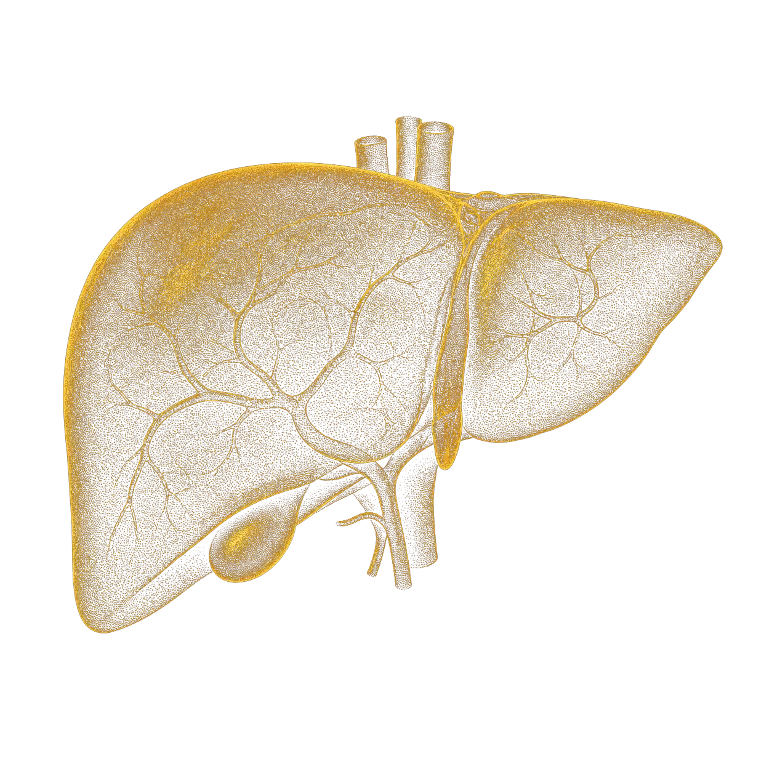
Liver-associated markers, including ALT, AST, and GGT.
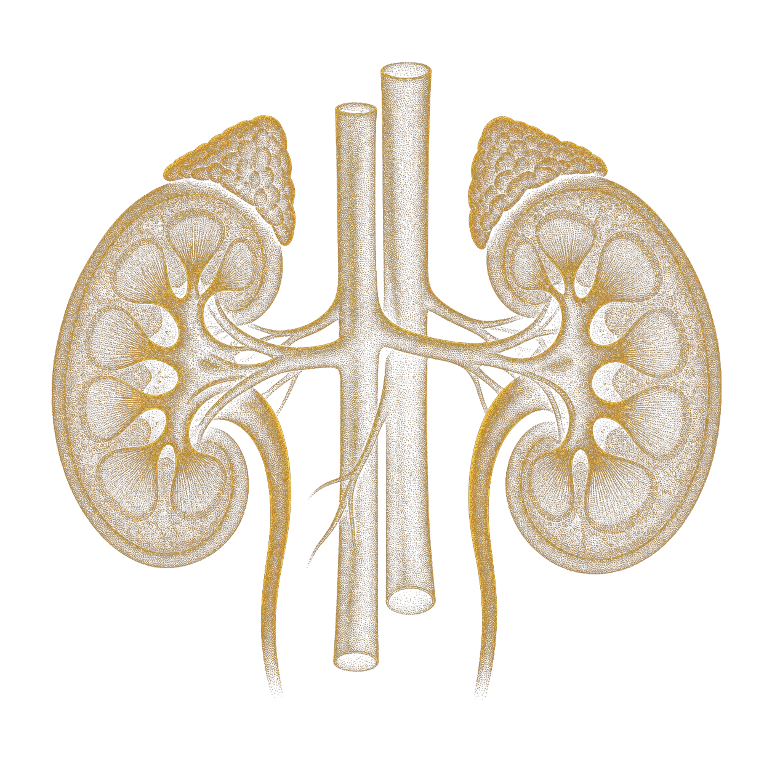
Kidney filtration markers, including creatinine, eGFR, and cystatin C.
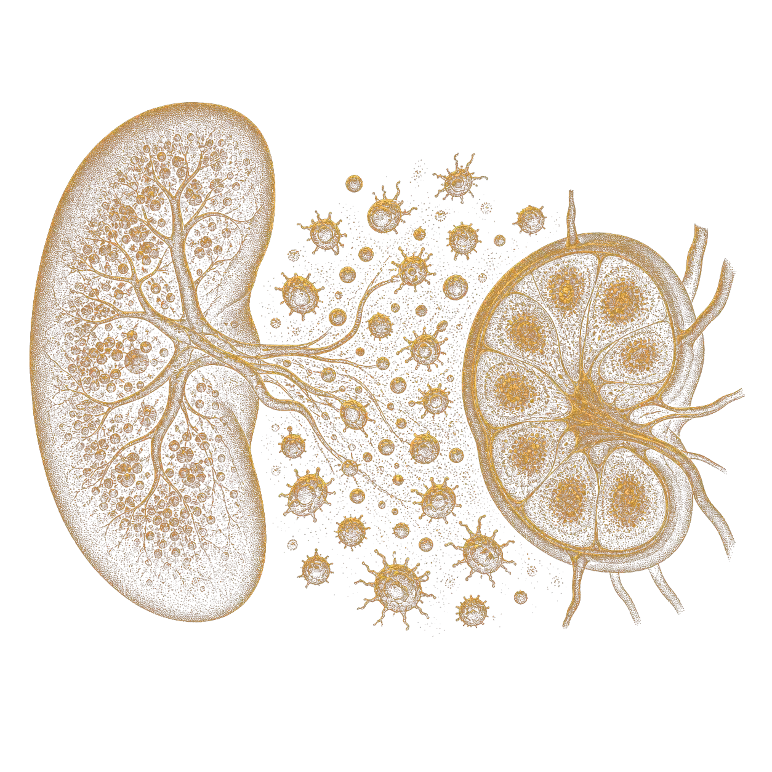
Inflammatory context from markers such as hs-CRP and ferritin.
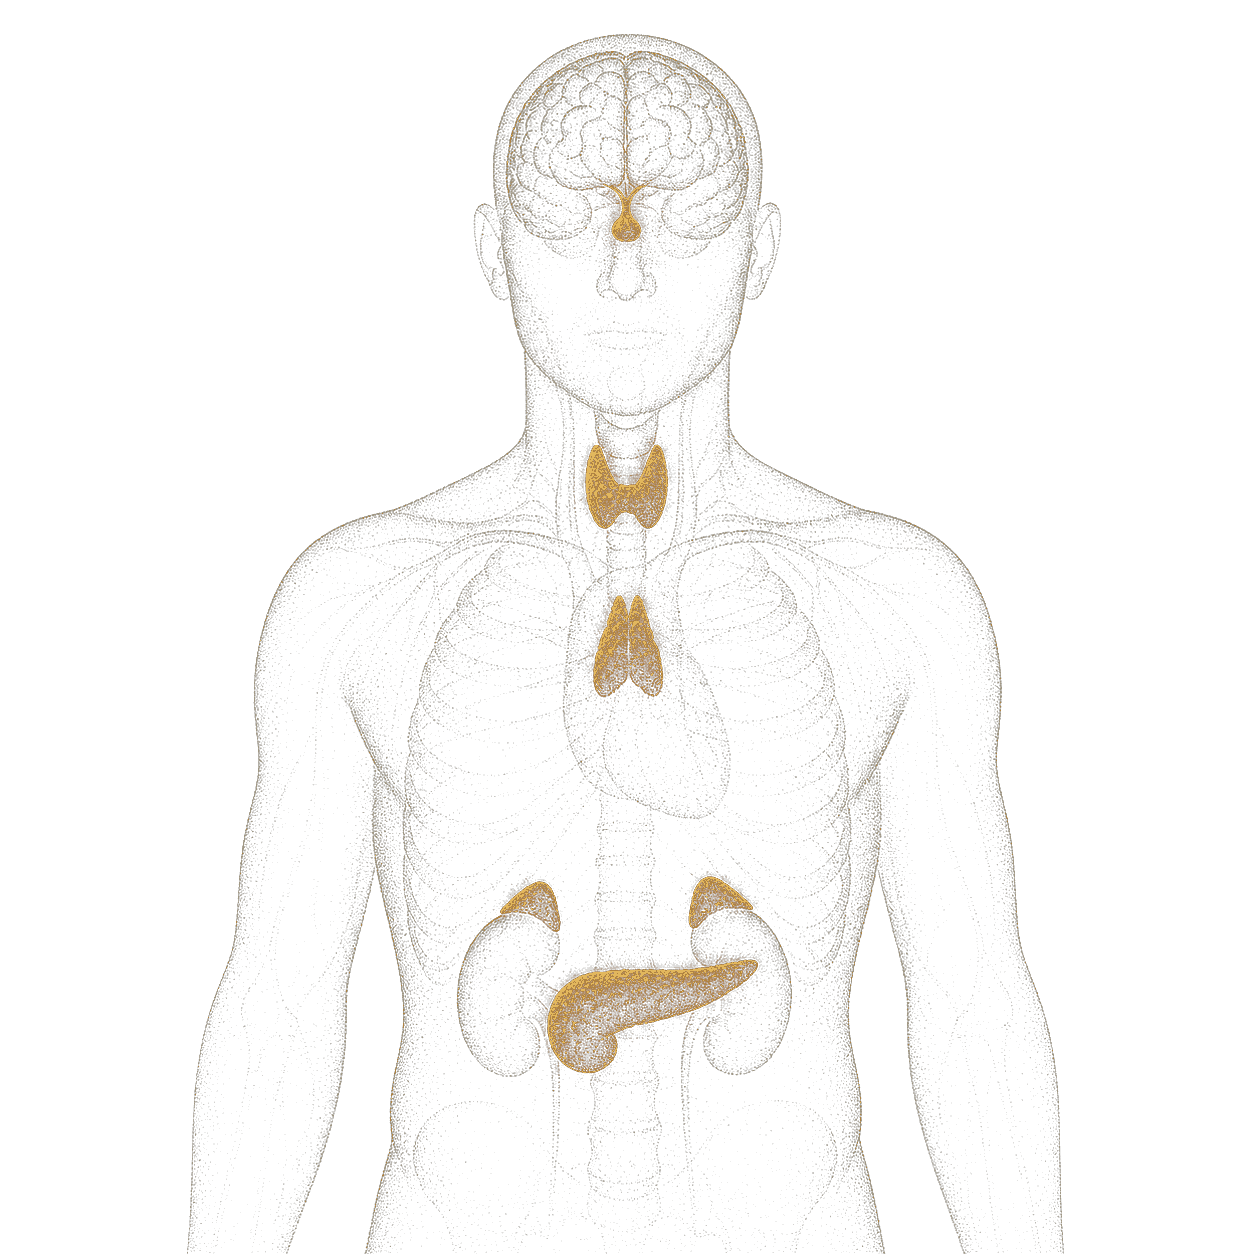
Thyroid, steroid-hormone, and related endocrine markers.
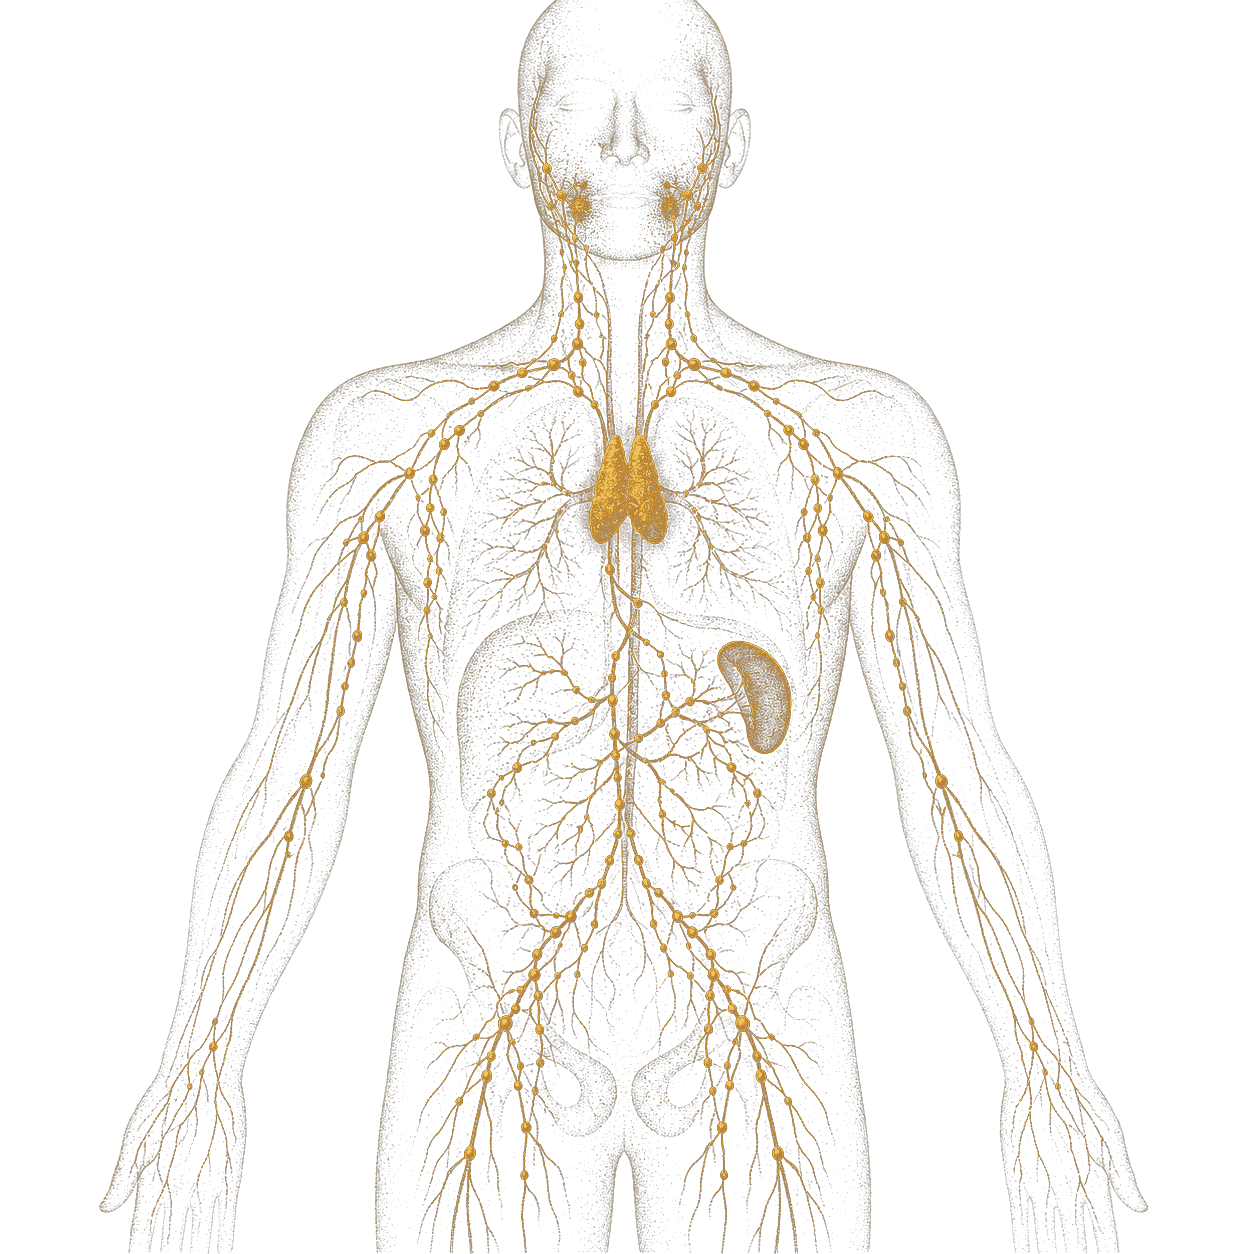
Immune context from white-cell counts and differentials.

Advisory context, including B12 and folate. Not a test of cognitive performance.
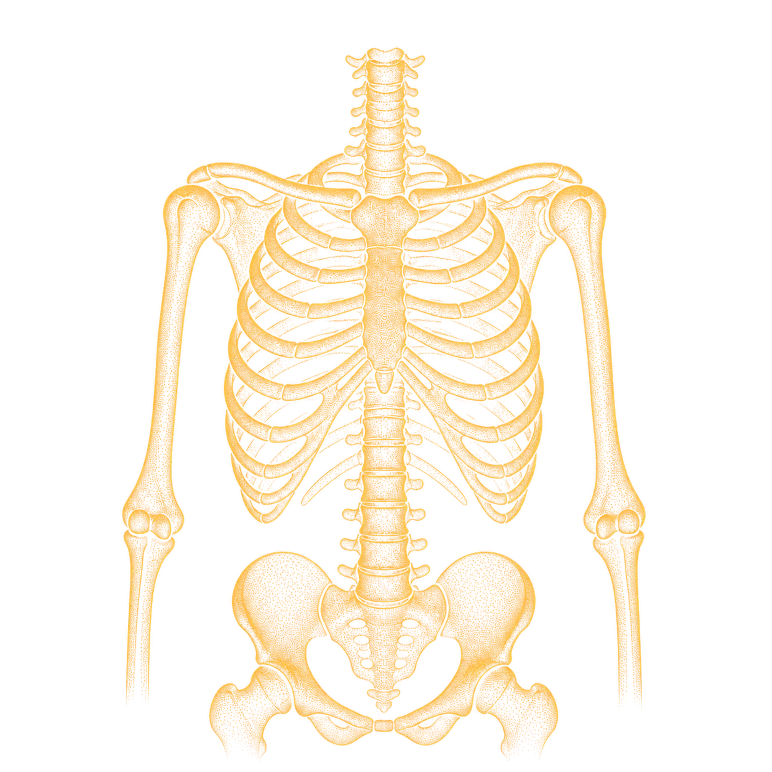
Advisory musculoskeletal context, including calcium and CK.
Lipids and vascular context, including ApoB, LDL-C, and hs-CRP.
Explore a dated recordComposite BioAge combines PhenoAge and a Longview advanced biomarker model when enough eligible inputs are present. The supporting system index is separate. These custom estimates are unvalidated, not a diagnosis or a measured biological age.
05 / Research context
Read evidence alongside your record, with its source and limitations attached. Research coverage and freshness vary; the workspace shows the last successful source checks.
Normalize measurements and connect biomarkers, exposures, concerns, and goals.
PubMed, ClinicalTrials.gov, openFDA, and DailyMed.
When source checks run, adapters validate returned identifiers. The workspace shows the last successful check and any unavailable sources.
Source-attributed studies, trials, and label updates ready for normalization.
This diagram explains the workflow. Actual source coverage, failures and last successful checks are shown inside your workspace.
Founder perspective
Preserve the source. Examine change over time. Separate a signal from an isolated observation. The thinking behind public health, applied to a personal record.